Markets
S&P 500 Faces Inflation, Rate and Valuation Risks. History Still Favors Staying In.
By Bear Creek Staff, . Bear Creek Capital Network.
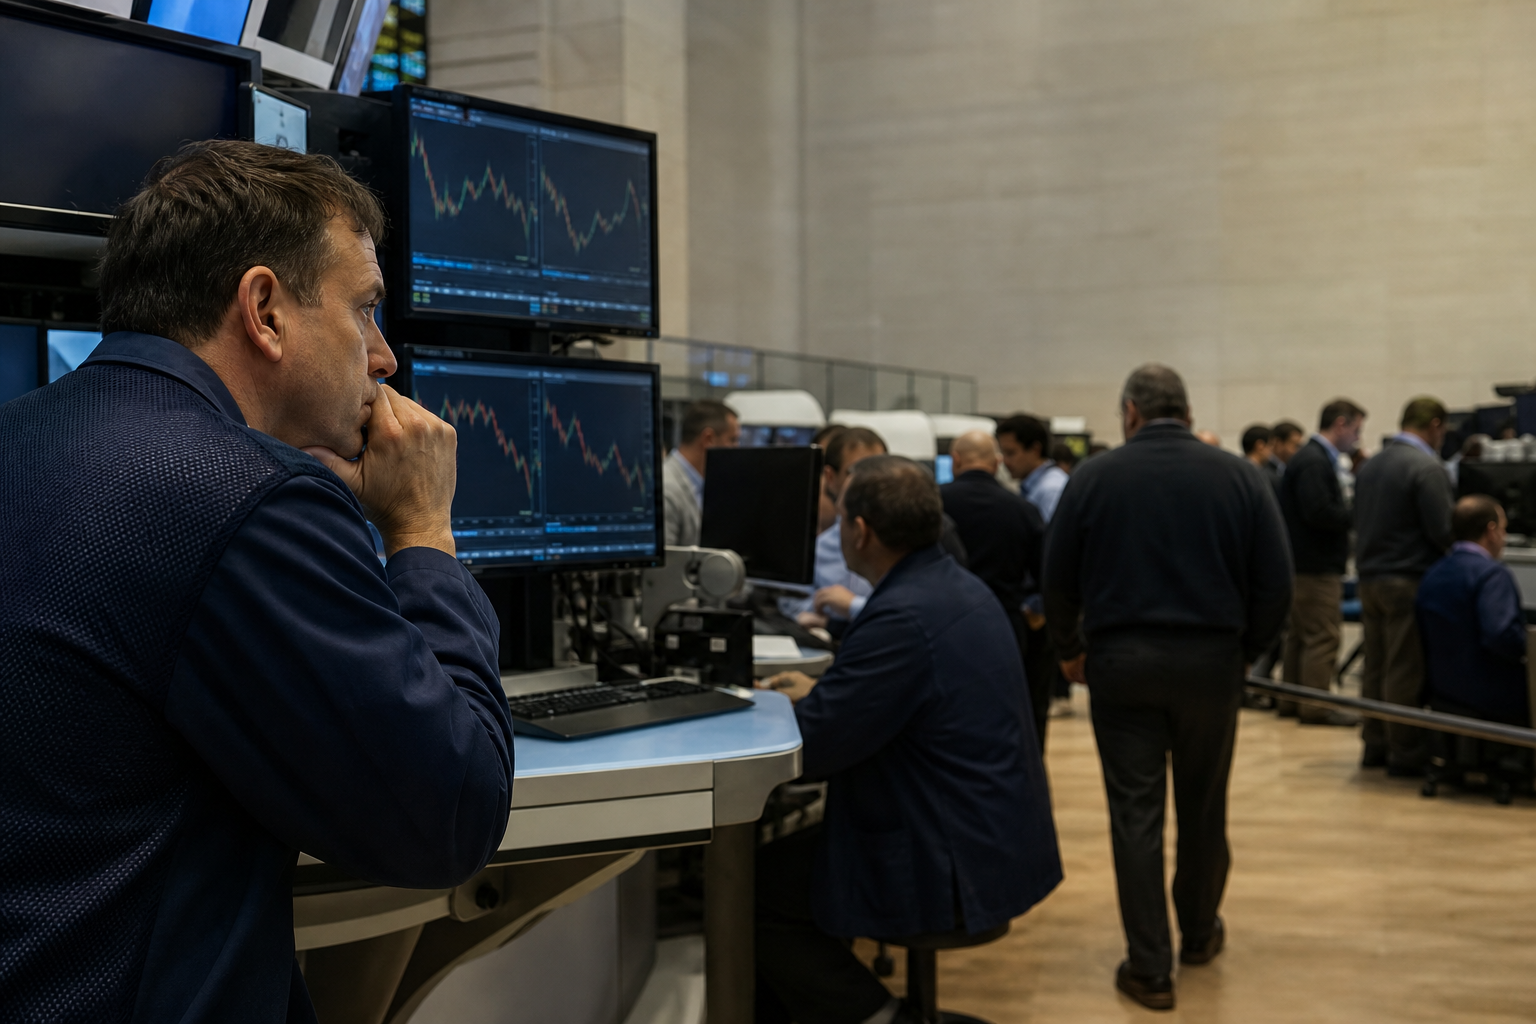
Three separate pressures are bearing down on the S&P 500 at once, and Motley Fool, writing for Yahoo Finance, has laid out the case that a crash is plausible even as it argues investors should not run.
What is driving the risk
The most immediate pressure is oil. A US-Iran conflict that began in February closed the Strait of Hormuz, through which 25% of the world's seaborne oil transits daily, according to the piece. Fighting between Saudi Arabia and Yemen has taken additional supply offline, and Russia and Ukraine continue striking each other's energy infrastructure. The result: West Texas Intermediate crude, a US oil benchmark, is trading above $100 a barrel, up from $57 at the start of 2026. That feeds directly into the prices of gasoline, diesel and jet fuel, pushing the Consumer Price Index, the government's main inflation gauge, to an annualized rate of 3.7% in September, well above the Federal Reserve's 2% target.
The Fed responded by raising its benchmark interest rate 25 basis points, or 0.25 percentage points, at its September meeting. The CME Group's FedWatch tool, which tracks market expectations for Fed policy, showed Wall Street pricing in at least one more hike before year-end 2026, the column noted.
Why this cycle may be more dangerous
Higher rates slow growth in a familiar way: consumers spend less on discretionary goods, companies borrow less for expansion, and investors discount future earnings more heavily. During the Fed's last hiking cycle, from March 2022 to August 2023, the S&P 500 fell more than 20%, meeting the standard definition of a bear market.
What is different now is the technology sector's exposure. The column points out that tech makes up 38% of the S&P 500, and companies across the sector are borrowing heavily to build artificial intelligence data centers. Smaller players, the piece cites CoreWeave as an example, have already seen their borrowing costs spike as investors question their ability to repay. If rising rates derail data center construction broadly, the index's largest sector faces a direct hit.
Valuation adds a third layer. The S&P 500's Shiller Cyclically Adjusted Price-to-Earnings ratio, which smooths earnings over a ten-year period to reduce short-term noise, is above 40. The column says that has happened only once before in the index's history: during the dot-com bubble ahead of 2000, when the index subsequently fell 49%. The author is explicit that a repeat of that decline is not the prediction, but a high CAPE ratio does mean the market has less cushion if any of the risks above materialize.
What history says about staying invested
The column's core argument is that the S&P 500, since its establishment in 1957, has produced a compound annual return of 10.7% across nearly 70 years, including every bear market and correction in that span. Capital Group data cited in the piece puts the average frequency of bear-market declines of 20% or more at roughly once every six years, and four years have passed since the last one.
The practical implication the column draws: an investor who bought at the absolute peak of the current bull market and simply held would, based on that history, eventually come out ahead. Selling in a panic, it argues, is the worst available response.
Where the argument has limits
The historical return figure is real, but it carries a qualification the column does not dwell on: a 10.7% compound annual return since 1957 is a long-run average that includes periods of very different valuations, interest rate environments and geopolitical conditions. An investor who bought at the peak of the dot-com bubble in 2000, when the CAPE ratio was similarly elevated, waited more than a decade to recover in real terms. The column's own comparison to that episode is the most important caveat in the piece.
What the reporting does not establish is how long a potential drawdown might last this time, or whether the AI infrastructure buildout represents a structural shift that changes the historical pattern. Those are the questions worth watching as the Fed's next decision and the next CPI reading approach.
Bear Creek Capital Network publishes content for informational and educational purposes only. Nothing in this article constitutes financial, investment, tax or legal advice, or a recommendation to buy or sell any security. Consider your own circumstances and consult a qualified professional before making financial decisions.